Introduction
The short answer is: seven. An MLB team usually has between five and eight players who made meaningful offensive contributions in games that they won, and seven is the most common number of key contributors.
Of course there is a longer, more complicated, more precise answer. You do not have to have seven exactly because it depends on the number of runs that you need to score to win. The better your pitching and defense, the fewer runs you will need to score and probably a fewer number of offensive contributors. The worse your pitching and defense, the more runs — and contributors — you will likely need. Moreover, a single player can sometimes produce a larger number of runs, in which case fewer offensive contributors are needed. So there are a lot of details that can matter, but a typical MLB team has about seven key offensive contributors in a game that it wins.
This article provides a brief analysis of where these answers come from. I explain how we can use the Offensive Shapley Win Credits (OSWC) statistic to gain insights into the number of offensive contributors needed to win an MLB baseball game. I then explore what the data show us about winning teams and their contributors.
This analysis also provides some insight into how the best teams in MLB win so often. As we will see, teams that win consistently will need several offensive contributions and that means that they need depth on their rosters. Yet, with strong pitching and fielding, you can also win without the depth in each game.
Using OSWC
To remind you, OSWC divides up the credit for one win among the offensive players on the team who made offensive contributions that were necessary for the win. Because players’ contributions are not all equally necessary, different players will receive different OSWC. However, if a player receives OSWC strictly greater than 0, then that player’s contributions were necessary to some degree as measured by the Shapley Value calculation.
This feature of OSWC means that we can use OSWC to explore the question of how many players are needed to contribute offense. In particular, we can simply count the number of players in the game that have OSWC strictly greater than zero to know how many players made contributions that were necessary for the win.
Lacking creativity, I will refer to a player who has OSWC strictly greater than 0 as an OSWC>0 player. I sometimes also more loosely refer to them as key contributors.
One more detail. The number of OSWC>0 players is not the minimally necessary number of players needed to outscore an opponent. That number could be one in many games if a single player hits more home runs than the other team scores runs in total. But that theoretical possibility is not very interesting. It is more interesting to identify the number of “typically necessary” contributors, and it is that sense of the word necessary that is used here.
The Distribution of OSWC>0 Players in MLB 2021
Figure 1 shows the number of MLB 2021 games (regular and post season) by the number of OSWC>0 players on the winning team. Both the median and the mode is 7 for these 2466 games. That is, the median of 7 means that approximately half of the MLB games have fewer than 7 OSWC>0 players and about half have more than 7 OSWC>0 players. 7 is the mode because it is the most common number of OSWC>0 players. This is where the short answer of 7 key contributors given earlier comes from.
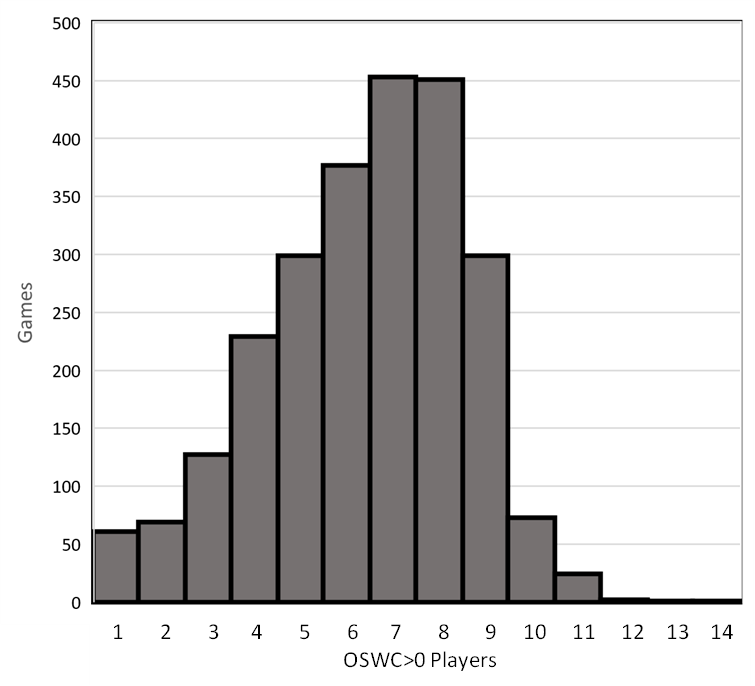
The average number of OSWC>0 players is 6.39, and the inter-quartile range is 5-8, i.e., approximately 50% of the MLB games had between 5 and 8 key contributors. This is why it is reasonable to say that you typically need between 5 and 8 key contributors to win an MLB game. Although some games can be won with just 1 key contributor and some were won with more than 10, about half of the time the game is won with 5 to 8 contributors.
Because the distribution of OSWC>0 players is skewed, the short answer is a bit fraught. The average of 6.39 key contributors is closer to 6 than to the median and mode of 7, so 7 is not exactly typical in strict sense even if it is the most common. So the simple answer of 7 should be accepted with a degree of caution.
It is not possible to have less than 1 key contributor and win, so 1 is the minimum number of key contributors. The absolute theoretical maximum is the total number of players on the team, either 25 for the regular season or 26 for the playoffs, but the maximum observed in the data is 14. That makes sense because about 13 or so players on the MLB roster are non-pitchers, making them the likely players to make key offensive contributions. But even within that 1-14 range the distribution is highly skewed to the left.
The 2021 NL West
Looking closer at the 2021 NL West lends some more insights. That division had the team the most regular season wins — the San Francisco Giants with 107 — and the team with the fewest wins — the Arizona Diamondbacks with 52 (tied with Baltimore). It also had the Los Angeles Dodgers (106), the San Diego Padres (79) and the Colorado Rockies (74).
Figure 2 displays the distribution of OSCW>0 players for each of the NL West teams. Obviously, the Giants and Dodgers won many more games than the other teams, so their distributions have more observations.
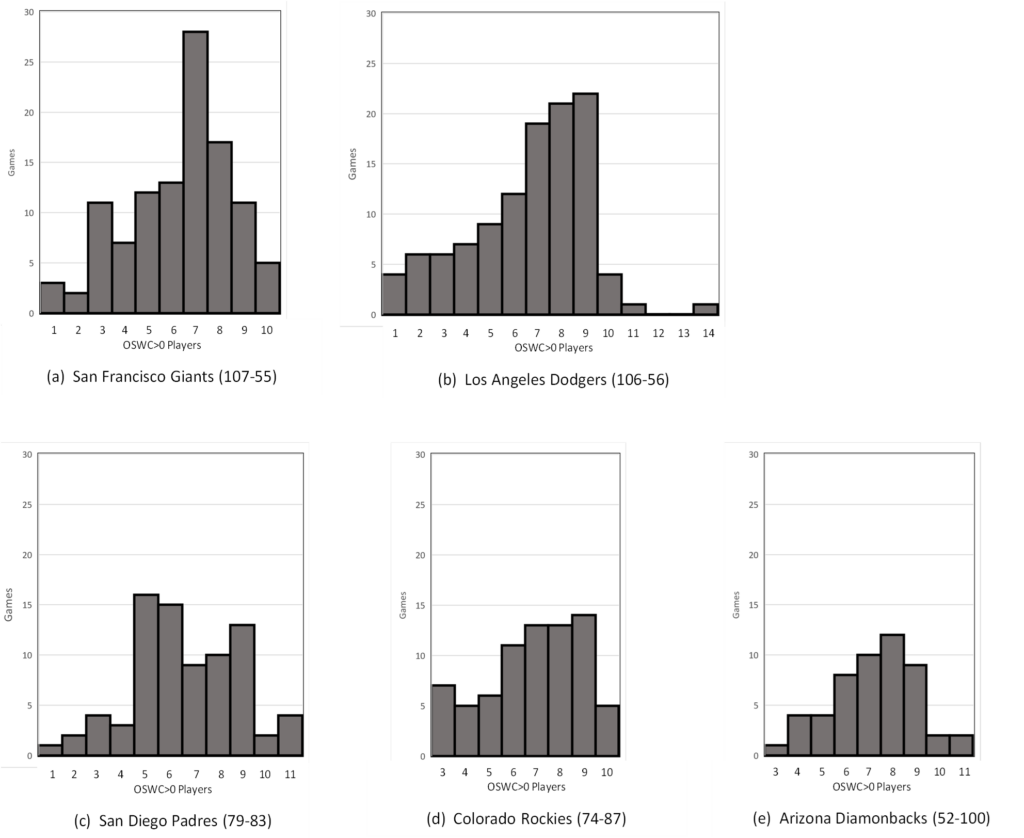
However, what is more interesting is that the Giants and Dodgers won many more games with only one or two key players than the others. In fact, the two best teams — the Giants and Dodgers — combined to win 15 games with only one or two key contributors, while the two worst teams — the Diamondbacks and Rockies — did not win any games with one or two key contributors. This makes sense when we recognize that the Giants and Dodgers allowed the fewest runs per game in all of MLB and were 2nd and 4th in home runs hit. A home-run hitter in a low-scoring game will usually receive a large share of credit, thus making other potential offensive contributors unnecessary. The Diamondbacks and Rockies were among the worst in both runs allowed and home runs hit. So for these teams to win, they were generally going to need more contributors. But if your team can hold the other team to no runs or 1 run, then you can win with just one or two key contributors.
Table 1 supports this logic. The better teams in the NL West had a lower average number of key contributors in their won games. Of course, the best teams won more games with a larger number of key contributors, too, but only those better teams were able to win several games with a small number of key contributors.

Despite these differences between the best and worst teams, the medians and interquartile ranges are very similar across teams. All teams but the Rockies have a median of 7 key contributors, and all teams have either 5-8, 6-8, or 6-9 for their interquartile range That means that it’s not just the typical MLB team that has about 7 key contributors in their team wins. The best and worst teams typically have about 7 key contributors in their wins, too.
Conclusion
MLB teams usually have about seven key offensive contributors in each team victory. It is not a surprise then that many of the best teams are teams with good offensive depth. To win a lot of games, a team needs to frequently get key offensive contributions from their sixth and seventh-best batters. The best MLB teams can also win games with just 1 or 2 key contributors because of their good run prevention and their home-run hitting ability. Yet, in most games, MLB baseball is truly a team sport with offensive contributions needed from many players.