Introduction
This series explores the effect of teammates’ offense on a player’s own total run production. Estimates of the teammate effect can then be used to predict how going from one team to another will affect a player’s overall run production.
The primary source of this offensive interdependence is the Sequencing Effect such that players combine positive offensive events into run-scoring coalitions. Part I of this series asked whether or not there is also a Spillover Effect such that a player’s batting outcomes are improved by having teammates with high batting skill. We determined that there is no such effect, so we will not worry about a Spillover Effect from here on.
Part II of this series now proceeds to directly estimating the Sequencing Effect to better understand the impact of one’s teammates on one’s own total run productivity. This simple estimation provides a rough, back-of-the-envelope calculation to demonstrate another use of SRC data.
The Simple Estimation
With no Spillover Effect, we can proceed confidently with our original equation of interest (the first equation from Part I). Doing so yields an estimated equation of
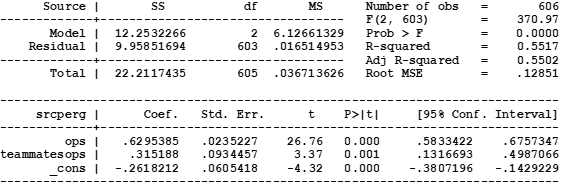
SRCperGame = 0.6295*OPS + 0.3152*TeammateOPS – 0.2618.
The Appendix provides the details of the linear regression. Table 1 here illustrates what this estimation implies about scoring.

An increase in Teammate 1’s OPS by 100 points (i.e., by 0.100 OPS) is associated with an estimated increase in 0.063 SRC per game for that player. Of course, that player’s increase in OPS also increases the SRC per game of the other eight teammates, and that is associated with an increase in each of those eight teammates’ (Teammates 2-9) run production of about 0.004 SRC per game. Overall, according to this simple estimation, the improvement in one teammate’s OPS by 0.100 is associated with an increase in about 0.091 runs per game for the entire team.
When all of the teammates experience an increases in OPS of 100 points, then each player experiences the effect of their own higher OPS on their SRC but also the effect of the other eight teammates’ higher OPS on their SRC. As seen in the last column of Table 1, the overall effect for any particular teammate is 0.094 SRC per game on average, and the overall effect for the team is about 0.850 runs per game.
Table 2 extrapolates these numbers to a 162-game season. A single player’s improvement in OPS by 100 points is associated with an increase of about 10.2 SRC for that player over 162 games and for 14.7 runs per game for the entire team. An increase in all teammates’ OPS by 100 points is associated with an increases in over 15 SRC per game for each player and an increase in almost 138 runs for the team for the season.

Improving the Estimation
I refer to the above as the “simple” estimation because it does not account for many other factors that can affect a player’s total run production. In fact, this simple estimation has an R-squared of only 0.55 (see Appendix), which means that the two variables and the constant are only explaining about half of the variation in the data. There are clearly other factors that are not included in the simple estimation but that would help to explain the remaining variation, thereby improving the estimation.
One issue is that this simple estimation assumes a linear relationship between OPS and teammates’ OPS and total run production. Linear estimations can often be surprisingly accurate in settings that are not perfectly linear, but their accuracy is of a local nature near the “middle” of the data.
Another over-simplification is that this estimation does not account for the place of the player in the batting lineup. If we think of the order of teammates listed in Table 1 as a batting lineup, then an increase in the leadoff batter’s OPS by 100 points (the first column of numbers) will have a larger effect on the run production for those batters who bat closer to that player in the lineup. The 0.004 SRC per game estimate, however, is averaging over all of the other players in the lineup so it is overestimating the effect for some teammates and underestimating it for others. Accounting for the batting lineup will improve the estimation.
Yet another factor to consider is the underlying change in the player’s or teammates’ OPS. Being able to generate hits will be more productive than walks, and hitting for power should have a different impact on total run production than hitting for singles. Breaking apart OPS into different types of offensive successes should generate additional improvements in the estimation.
Finally, this estimate used individual-season level data, and players who were traded were removed from the analysis. A finer-tuned analysis would consider game-level data and keep all players in the data set.
Future work can explore these and other considerations to improve upon the simple estimation.
Conclusion
This article shows that an increase in a player’s teammates’ OPS by 100 points (0.100 OPS) is associated with an increase of about 0.004 SRC per game for the player. This simple estimate does not account for non-linearities in batting outcomes, place in the batting order, and other factors.
Appendix
Table A1 provides the linear regression results from the simple estimation.
Great post.