Introduction
Th 2021 MLB Offensive Shapley Win Credit (OSWC) Top-50 leaderboard is filled with the best hitters. As seen in Table 1, the players with the highest OSWC for the 2021 season were also on the best teams. Eight of the top ten and fourteen of the top twenty were on teams that won 90+ games. This is not a coincidence: good teams are good because they have good players.
However, there is more to this story. Because OSWC splits the offensive credit for winning among the players on the winning team, teams that win more games will have more win credits to split, and this mathematical fact suggests that players who happen to play on good teams might have a boost in their OSWC by virtue of being on a good team rather than by their skill alone.
On the other hand, good teams have a larger number of good players, and this means that players on good teams are competing with a larger number of good players for those win credits whenever their team wins. If the number of players competing for a share of the win credit is larger, relatively speaking, than the win credits to split, then there might not be an OSWC boost for being on a good team. In theory, there could actually be an OSWC penalty for being on a good team.
This idea of a win credit boost or penalty is not new in sabermetrics. Bill James and Jim Henzler (Win Shares, STATS Inc. Publishing, 2002, pp. 168-173) acknowledge that their Win Shares metric may have a boost or penalty for these reasons. They suggest that the two effects cancel each other out in their Win Shares metric so that there is no boost or penalty. Although they do not provide a formal statistical test of their claim, they provide some example cases that suggest there is no boost or penalty.
This article uses data from the 2021 MLB season to statistically estimate and test whether or not players receive an OSWC boost or a penalty for being on a good team.1 The analysis reveals that, on average, there is an OSWC boost for being on a good team. Winning 50 additional games in a 162-game season, holding the player’s offensive skills fixed, is associated with the player accruing an additional 3.16 OSWC for the season. After presenting these results, I then offer some comments about putting this finding in proper perspective.
The Estimation Procedure
The equation we want to estimate is
OSWCperGame = a*OPS + b*TeamWins + constant.
The higher a player’s OPS, the higher that player’s OSWC per game, so coefficient a should be positive. If coefficient b is positive, then there is, on average, an OSWC boost for the player from being on a team with more Team Wins, but if coefficient b is negative, then there is an OSWC penalty for being on a good team.
However, Team Wins depends in part on the player’s OPS, so if we estimate this equation as is, then our estimates for b would be incorrect. To solve this endogeneity problem, we use a Two-stage Least Squares (2SLS) Estimation Procedure. (A related endogeneity problem and 2SLS estimation procedure were discussed in an earlier article about estimating a spillover effect in OPS across teammates.)
This 2SLS procedure uses an instrumental variable in the first stage to estimate how a player’s Team’s Wins depend on that player’s OPS, their teammates’ OPS, and the defensive effectiveness of the team. It then uses the Predicted Team Wins from that first stage in the place of the actual Team Wins in our desired estimation equation as the second-stage regression.
Finally note that the equation predicts the player’s OSWC per Game rather than the player’s OSWC for the season. As an accumulating metric, Season OSWC will tend to be higher for players who play in more games, so using OSWC per Game will not misidentify OSWC that is due to playing more games rather than having more wins. Of course, both team wins and OSWC are defined at the level of the game, so OSWC per game also makes intuitive sense as the variable to predict.
Results
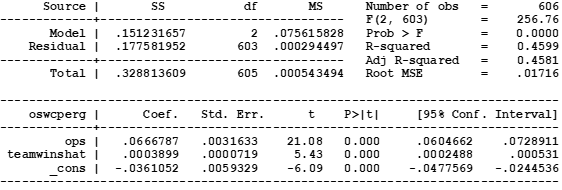
The full regression results for the first and second-stage regressions of the 2SLS estimation procedure are provided in the Appendix below. Our revised equation of interest (the second-stage regression) with estimates is
OSWCperGame = 0.0667*OPS + 0.0004*PredictedTeamWins – 0.0361.
All coefficients are highly significant and statistically different from zero under standard hypothesis tests. In particular the positive and statistically significant 0.0004 coefficient on Predicted Team Wins implies that there is, on average, a positive OSWC boost for being on a team that has more wins.
The 2SLS estimation procedure is designed to separate the effect of the player’s batting skill from the rest of the teammates’ ability to win games. Thus, according to the coefficient on Predicted Team Wins, having one more team win due to having better teammates and defense, holding fixed the player’s own batting ability as measured by OPS, is associated with an increase in a player’s OWSC per game of 0.0004. While this may seem small, it accumulates over many games and wins, as shown in Table 2.

One additional team win (that arises for reasons other than the player’s batting) during a 162-game season is associated with 0.0004 more OSWC per Game, and that works out to an additional 0.06 OSWC for the season. Ten more wins is associated with 0.0039 more OSWC per Game, and that works out to an additional 0.63 OSWC for the season. Fifty additional wins is associated with 0.0195 more OSWC per Game, which is additional 3.16 OSWC for the season.
Holding fixed the player’s own OPS is important for the interpretation because it allows us to say that the boost arises from the team’s additional wins holding fixed the player’s own batting output. That makes it a boost from teammates in the true sense of the word. If you take a player with a certain OPS but move them to a better team and keep their OPS the same, then they will get some extra OSWC merely by virtue of being on the better team.
2021 Orioles vs. 2021 Rays
In the 2021 MLB regular season, receiving an additional 50 wins is akin to moving from the AL West-worst Baltimore Orioles with their 52-110 record to the AL West-best Tampa Bay Rays and their 100-62 record — an increase of 48 wins. Okay, that is 48 (not 50) wins from the Orioles to the Rays, so the boost would then be an estimated 3.03 OSWC advantage to a Ray over an Oriole with identical batting skill.
We can also compare some specific Rays with some comparable Orioles. With this 48-game difference, the Ray with the same batting skill as the Oriole is predicted to have OSWC per Game that is about 0.02 higher than the Oriole. Table 3 shows this difference is not too far off for five pairwise comparisons.

In each comparison, the Ray has a higher OSWC per Game than the corresponding Oriole despite having nearly equal OPS, thus demonstrating the clear boost. The actual differences range from 0.008 to 0.034 but are always around the ballpark of the predicted 0.02 difference. This boost occurs for the strongest batters (Austin Meadows vs. Austin Hays) as well as for the weaker ones (Taylor Walls vs. Maikel Franco).
Even if we expand the comparisons to include players with slightly less similar OPS, we still find the same pattern (not shown in the table). The Ray always has the higher OSWC per Game than the Oriole comparison. For example, the Rays’ Brandon Lowe has 0.863 OPS and 0.076 OSWC per Game, while the Orioles’ Cedric Mullins III has a higher 0.878 OPS but still has a lower OSWC per Game of 0.041). The OSWC boost for the Rays is found in all comparisons of similar or roughly-similar players.
Of course, in some cases the actual Season OSWC differs substantially between the players because they played in a very different number of games. Consider the Ji-Man Choi vs. Trey Mancini comparison. They have identical OPS of 0.758, and Choi has the larger OSWC per Game. Yet, Mancini has more total OSWC for the season because he played in many more games.
Is the OSWC Boost a Feature, a Flaw, or Something Else?
James and Henzler seem very concerned that a boost or penalty might exist with the Win Shares statistic, as if the presence of a boost or penalty would undermine the value of the Win Shares metric. However, my position on this matter is very different. In my view, a proper and fair credit accounting statistic will measure what happened in the context in which it happened. That is: if there’s a boost, then there’s a boost, and if there’s a penalty, then there’s a penalty. The boost or penalty is not a feature or a flaw; it is just an attribute.
In fact, in the case of OWSC, the boost is an attribute that teaches us something that we did not know before. As James and Henzler speculated, it was logically possible that there could be either a boost or a penalty, so whether there is a boost or penalty is fundamentally an empirical question to be answered though empirical analysis. That I found a boost (not a penalty) teaches us that in 2021 Major League Baseball, players on better teams were able to contribute more to winning than players of equal skill on worse teams.
This finding implies that there was a synergistic effect of having good players on your team such that good players help other good players create wins more effectively. This seems to me to be not only very plausible for Major League Baseball, but also a general feature of baseball. To be clear, though, I have only examined one Major League Baseball season, and without a mathematical proof, it remains possible that an OSWC penalty exists in another baseball universe–just not in 2021 Major League Baseball.
Conclusion
Players on good teams accrue extra OSWC above by virtue of having good teammates. This OSWC boost, which arises separately from their own batting skill, works out to about 3 OSWC over a 162-game season for 50 additional wins. This boost is not a feature or flaw with the OSWC statistic. Rather, it is an attribute that emerged given the nature of Major League Baseball in 2021.
Appendix
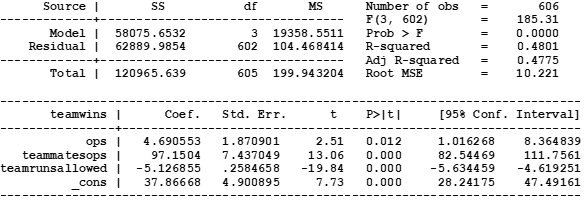
The first-stage regression is
TeamWins = c*OPS + d*TeammatesOPS + e*TeamRunsAllowed + constant.
We should expect that coefficients a and b are positive while coefficient e is negative. Teammates’ OPS and Team Runs Allowed are the two instrumental variables. From an earlier article on a Spillover Effect, we know that a player’s OPS does not depend on their Teammates’ OPS. Similarly, a player’s OPS should not depend, in principle, on their team’s defensive ability. Both should also be highly correlated with Team Wins, thus making them both valid instruments.
The regression results are shown in Table A1. As expected, coefficients a and b are positive while coefficient e is negative.
The second-stage regression is
OSWCperGame = a*OPS + b*PredictedTeamWins + constant.
The results are shown in Table A2.