Introduction
Corey Seager had a fantastic 2020 World Series for the Los Angeles Dodgers. Over the six games in the series, he batted .400/.556/.700 for a 1.256 OPS with 2 HR, 7 R, and 5 RBI. As one of the best players on the best team in baseball that season, this World Series was a showcase of his skills and contributed to his case as a superstar. He was so good that he was named the World Series MVP. Given his batting statistics, it was not a surprise selection.
The only problem is that Seager was not the position player who contributed the most to the Dodgers’ World Series victory. That honor belongs to Mookie Betts. Yes, Betts’s AVG/OBP/SLG slash line was not as good as Seager’s. Betts only batted .269/.321/577 for a .898 OPS with the same number of HR (2) but fewer R (5) and RBI (3). And, yes, Seager had more success in high-leverage settings. Seager’s total Win Probability Added (WPA) for the series swamped Betts’s: a whopping 0.628 to -0.013. However, a closer examination of what it means to be valuable and how to measure it reveals that Betts was the more deserving player for the MVP award.
Before proceeding with this argument, consider three caveats. First, I will be considering only offensive contributions. We would ideally have accurate measures of both offensive and defensive contributions, but I feel justified in the focus on offense. For one, the 2020 World Series MVP award was given to a position player not a pitcher, and the award appears to have been given to Seager primarily for his offensive contributions. Moreover, Betts appeared to have been the more impressive defensive player in the series, so I do not think that Seager’s defensive contributions were a reason why he was selected over Betts.
Second, I will only be considering direct contributions. Consider a lead-off single in an inning in which no runs eventually score. Although this single did not directly help the team score, it might have indirectly helped later scoring by tiring out the pitcher and enabling later batters to have offensive success. These types of indirect contributions are very difficult to measure and as a consequence they are not specifically accounted for in any of the standard offensive performance measures. My ignoring of them is not unique.
Third, I am not arguing that Betts should have been the MVP award winner. Instead, I am arguing that Betts was more deserving that Seager, and that implies that Seager should not have been selected as the MVP. It is possible that one of the pitchers (Clayton Kershaw maybe?) was more deserving that any of the position players. There is just no good way to know for sure because we do not currently have a good way to directly compare pitcher performances with position-player performances in a World Series. Nonetheless, if the MVP award is to be given to a position player for their offensive contributions, then Betts should have been given the award. The numbers and logic behind that claim are just too compelling.
There are three parts to my argument. The first is a conceptual one about how we should think about contributions to winning a game and a series. The second is an argument that the Offensive Shapley Win Credits (OSWC) measure better calculates the value of a player’s direct offensive contributions to their team’s wins than other available measures. Finally, I show that according to the OSWC measure, Betts was a more valuable players than Seager in the 2020 World Series.
Value is What Helps the Team Actually Win
What offensive performances are most valuable to the team? I argue that the offensive performances that matter the most are the ones that directly contribute to the team winning the game. Notice the two aspects of this claim:
- Contributions that directly foster the victory are more valuable than others.
- Value will depend on how the contributions combine with teammates’ contributions.
The MVP award winner should thus be the player who best worked in collaboration with their teammates to help the team win the series. Let us reflect on that logic.
First, not all offensive contributions are of equal value because some help the team win to a greater degree than others. This should not be a surprise to any baseball fan who believes that a home run is more valuable than a single. But it is also true that one home run can be more valuable to the team than another home run, even when they both score the same number of runs. What makes one offensive contribution more valuable to the team than another is whether it helps the team win. For example, a walk-off two-run home run in a 2-1 victory is much more valuable to the team than a two-run home run in a 10-2 loss. The home run secured the win in the former case but did not have the same impact in the latter case, so the latter home run was less valuable. Therefore, the player whose offensive events most helped the team win will be the player whose offense was the most valuable.
Second, because winning typically requires teamwork, the value of one player’s offensive contribution also depends on how it works in collaboration with other players’ contributions. Consider these two batting innings in a 1-0 victory.
- Inning 1: double, strikeout, strikeout, strikeout to end the inning. 0 runs scored.
- Inning 2: double, sacrifice bunt that advances runner to third base, sacrifice fly that score runner from third base, and strikeout to end the inning. 1 run scored.
Both doubles had the same potential for run scoring as they both led off the inning. However, the second-inning double was ultimately more valuable than the first-inning double because it was a part of the run-scoring collaboration that led to the victory. The first-inning double was akin to the 2-run home run in the 10-2 loss, i.e., a good offensive event that just did not impact the outcome of the game as much as the second-inning double because it was not sequenced with other teammates’ contributions. Therefore, the impact of a player’s offensive event on winning will depend on how well that event combined with other teammates’ offensive events.
These two points together imply that the most valuable player is not necessarily the most skilled player but rather the player whose contributions worked best with their teammates’ contributions to achieve the victory. This conclusion runs counter to how many people treat the regular season MVP award as a Best Player of the Year award. MVP voters are free to decide their votes in such a way if that is how they want to interpret what value means, but that interpretation is not how playoff series MVP award selections have traditionally been made. Playoff MVP selections have generally been closer in spirit to what I am proposing, i.e., the playoff series MVP is thought of as the player whose contributions were most critical to the success of the team in that series, not the best or most skilled player.
In order to select the MVP award winner using this understanding of value, we would ideally have a measure of value that identifies how much each player’s offensive event helped the team win in the collaborative team context in which that event occurred. Using the AVG/OBP/SLG batting slash line to select the MVP award winner is less than ideal because the slash-line statistics do not accurately measure the degree to which the offensive events helped the team win. Getting on base in an inning often helps the team win but sometimes does not, and extra base hits are more likely to help with scoring than singles but not always. Yet, each measure in the batting slash line treats each single the same as any other single, each home run the same as any home run, and so on, no matter when it occurred and no matter whether it directly contributed to a victory or not.
A more appropriate measure to use when selecting the MVP award winner would capture how the player’s offensive contributions helped the team win. It would distribute the credit for a team victory among the players who deserve it, with more credit going to the players whose contributions were more important for the victory. The player whose contributions receive the most credit would therefore be the most deserving MVP candidate among those considered.
Of the measures widely known within the baseball community, the one that comes closest to what I have in mind is WPA (Win Probability Added), but WPA is also a problematic measure to use when selecting the MVP. Its fundamental shortcoming is that it does not actually assign credit for winning; instead, it assigns credit for increasing the chances of winning. This distinction matters when thinking about value, so much so that it makes WPA an inappropriate measure of value to use when selecting the MVP.
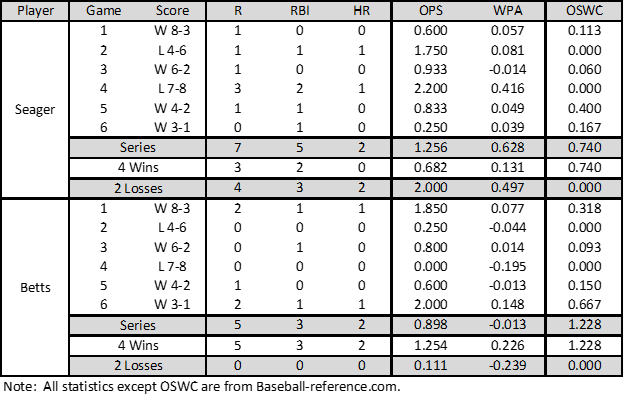
To help us understand why, Table 1 provides various offensive contribution measures for Seager and Betts for the six games of the 2020 World Series. As stated earlier, Seager’s 0.628 WPA for the series puts Betts’s -0.013 WPA to shame. But notice that 0.497 of Seager’s WPA is actually from the Dodgers’ two losses. In fact, both of Seager’s home runs and most of his R and RBI came in those two losses. Seager played incredibly well in those two games, but because the Dodgers lost both games, his performance in those games, although impressive, did not help the team win the series in the same way that Betts’s contributions did in the other games. Thus, many of Seager’s contributions were more like a home run in a blowout loss than a home run in a one-run victory. Conversely, all of Betts’s HR, R, and RBI came in the wins, and his WPA in the wins actually exceeds Seager’s. Betts’s offensive events therefore contributed more value than Seager’s.
By this reasoning, looking only at the slash line or WPA for the series can be misleading when assessing how valuable a player’s offensive contributions were to their team’s series victory. Looking at the slash line and WPA in just the victories is also not quite right because even within a game not all singles are of equal value, not all doubles are of equal value, and so on. The batting slash line for a game can thus give a misleading sense of value. Looking at WPA for the game is also misleading because it credits offensive contributions differently at different points in the game depending on how much of the game remains to be played. However, all runs count equally in the final score of that game and should be equally valued. Of course, the emotional impact of a run scored later can be much higher than for a run scored early in the game, and WPA helps us to measure that type of impact. But counting the run later in the game as more important than the run earlier in the game is like counting the sacrifice fly that scores the runner as more important than the double (and sacrifice bunt) that made the sacrifice fly possible. All direct contributions – the double, the sacrifice bunt, and the sacrifice fly – were necessary in that run-scoring collaboration. WPA is thus a problematic measure of value and team collaboration.
A better measure of value would treat all contributions fairly and not over-weight or under-weight then based on whether the game is closer or further from its conclusion.
Why OSWC is the Best Measure of Offensive Value
An ideal measure would credit a player for how their contribution helped the team win the game or series. It would take all the credit that is available to be assigned and distribute it fully among the possible contributors. It would distribute the credit fairly so that a player whose contributions mattered more for the victory would receive a larger share of the credit. Finally, it would be easy to interpret and aggregate across games.
Offensive Shapley Win Credits (OSWC) is the measure that comes closest to this ideal. For each win, OSWC splits the credit for that win among the players using a concept from coalitional game theory called the Shapley Value. The Shapley Value is a mathematical formula that calculates each team member’s fair share of the team production when that production results from the collaborative efforts of the team members. Because of its desirable theoretical properties, it is widely used in business and legal settings to award credit shares. Its creator, Lloyd Shapley, after whom it is named, received the Nobel Prize in Economics in part because of the Shapley Value idea.
OSWC is literally the Shapley Value for the offensive players on a team whose objective is to win the game by outscoring the other team. The offensive play events from the game are assigned to the various players, and then a computer program reconstructs how many runs the team would hypothetically score when various subsets (coalitions) of the players combine their offensive events. Note that using a hypothetical reconstruction to create a statistic is not new in baseball, e.g., official scorekeepers perform hypothetical reconstructions when judging whether a run is earned or not. The Shapley Value for a player is calculated as the average marginal contribution of that player when added to the possible coalitions. It captures fairness because each player’s credit reflects how much it helped the team win in the context of the team’s collaborative efforts. OSWC thus calculates a player’s share of credit for their team’s success in outscoring the opponent. The losing team’s players’ OSWC will sum to 0. The winning team’s players will have OSWC that sum to 1 so that OSWC assigns full credit for the victory among the players, and those players whose offensive contributions were more important to the win receive more of the credit.
One of OSWC’s desirable features is that it accounts for many different types of offensive contributions, not just the offensive measures in a typical box score such as singles, doubles, home runs, and stolen bases. It will, for example, give credit for making productive outs, such as a ground out that advances a runner who eventually scores in a close game. Any offensive event that was important to the team’s success in outscoring the opponent will be given a share of credit, and the size of that share will depend on the size of its importance. Unlike the batting slash line, each hit or successful time on base gets different credit depending on whether it actually helped the team outscore the opponent in that game. Unlike WPA, offensive events latter in the game are not given heavier weight just because they are closer to the end of the game where the likelihood of winning can vary widely on one play.
The 2020 World Series Offensive MVP According to OSWC
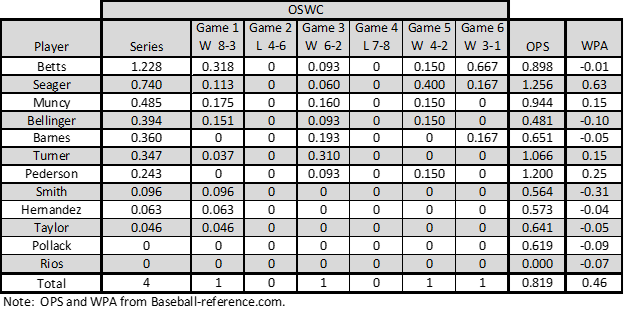
The last column of Table 1 provides the OSWC for Seager and Betts for each of the six World Series games. For a benchmark, a one-ninth share of a single win is 0.111, and a one-ninth share of four wins is 0.444. Betts amassed 1.228 OSWC across the games in the series, which is 31% of the 4 OSWC that is available for the four wins. In other words, Betts deserves a whopping 31% of the offensive win credit for the series victory when summing the OSWC across the games. Betts’s OSWC is actually one of the highest World Series OSWC over the last thirty years. Seager’s 0.740 is not shabby at all and would have been the highest World Series OWSC in a dozen of the last thirty years, but it was only 60% of Betts’s 1.256 OSWC.
A closer look at game 6 reveals how OWSC captures the winning value of different offensive contributions. The Tampa Bay Rays scored 1 run in the game, so the Dodgers needed to score 2 or more runs to win. Table 2 lists the play events from the two innings in which the Dodgers scored. Notice that Betts himself crossed home plate twice for two of the Dodgers’ three runs, and that fact alone suggests that the Dodgers would not have won that game without his contributions. As seen in Table 3, OSWC calculates that Betts earned two-thirds of the total offensive credit for game 6 (0.667 OSWC) and that Barnes and Seager deserved to split the remaining one-third credit for one-sixth (0.167 OSWC) apiece. All other Dodgers received 0 OSWC in game 6. Getting 0 OSWC means that their offensive events did not earn direct credit for the win according to the Shapley Value calculation because their hits, walks, or other contributions were not part of run-scoring coalitions that helped the team win. That is, their offensive events did not have direct winning value. Their offensive events may have had some indirect value, such as wearing down the opposing team’s pitchers or speeding up times through the lineup, to help create the value credited to those with positive OSWC. Such indirect contributions are not captured in the OSWC Shapley Value calculation (or in slash-line statistics or WPA for that matter).

These OSWC numbers reflect the relative importance of the players’ offensive events for the game 6 win. Given that the Rays scored 1 run, no player’s offensive contributions alone could win the game. Even for Betts, his solo home run would tie the game, but he would not have scored after his double without being batted in by another player. However, Barnes and Betts can combine their offensive events for two runs and the victory without Seager, and Seager and Betts can combine their offensive events for two runs and victory without Barnes, but Barnes and Seager cannot combine for a victory without Betts. Therefore, Betts deserves more credit for the game 6 victory than Barnes and Seager because his offensive contributions were necessary for the victory while theirs are not always necessary. Neither Barnes nor Seager were necessary alone, although one of the two was necessary in conjunction with Betts to win the game, and that is why the Shapley Value calculation splits the last third of credit between them.
Betts had the highest OSWC among the Dodgers when summing over the games in the series, so he is the position player with the most valuable offensive contributions toward the World Series victory. Seager had the second highest OSWC, so he was also very important to the Dodgers’ success. Muncy deserves the third most credit. He batted .318/.444/.500 for a .944 OPS with 1 HR, 3 R, 6 RBI, and 0.15 WPA for the series. Table 3 shows that, by OSWC, he was a meaningful contributor in games 1, 3, and 5 but not 6, whereas Betts and Seager has positive OSWC in all four victories. We also see that several other Dodgers also deserve a positive share of credit across the series. Because baseball is a team sport, it should be expected that many players will deserve a share of credit. The most valuable player is not the only valuable player, just the most valuable among many who contributed to the series victory.
Note how this 1-2-3 ranking of Betts, Seager, and Muncy compares with other rankings. These three are also in the top five for OPS and WPA among Dodgers’ position players in the series, revealing that OSWC is positively correlated with other measures of offensive performance. However, the OSWC ranking differs because OSWC assigns value to offensive events differently. Consider the two other highly ranked offensive players by OPS and WPA: Pederson (1.200 OPS, 0.25 WPA) and Turner (1.066 OPS, 0.15 WPA). Pederson’s OSWC is seventh for the team because, even though he made significant contributions when he played, he was a platooning player who played fewer innings. Series OSWC is an additive statistic, and Pederson had fewer opportunities to accrue Series OSWC. Turner’s OSWC comes mainly from game 3 in which he hit a HR, scored twice, and had the game-high OSWC, but he had 0 OSWC in games 5 and 6 indicating that his offense was directly valuable in only two of the wins. In short, Pederson and Turner had valuable offensive contributions in the series but less so than Betts, Seager, and Muncy. Perhaps more surprising is that Bellinger, who ranks eleventh out of the twelve position players in OPS and WPA, has the fourth-highest OSWC. His few positive offensive events in the series were well sequenced with his teammates and meaningfully contributed to three of the four wins.
Conclusion
As measured by OSWC, it is not overall offensive performance but rather how that performance helps the team win that matters. Seager had a fantastic World Series, but Betts played a more valuable role in the Dodgers’ series win. We need not be upset that Seager was given the MVP award because he played exceptionally well in the series and was a valuable player. However, a closer consideration of value reveals that Mookie Betts was a more deserving recipient of the World Series MVP award.
Notes: This page uses version an older version of calculations that have since been updated.